You can't lose with SIPs: if you stick around long enough
Across 29 years of Indian equity market history and 120 diversified funds, no 10-year SIP investor has ever ended in the red. Not low probability – zero. The maths is straightforward; the behaviour is the hard part.
By Kshitij Jain

There is a particular kind of investor anxiety that peaks precisely when it should be ignored. Markets fall. Your SIP statement goes red. The urge to pause the monthly debit feels rational, even prudent. It isn't.
The data, assembled across nearly three decades of Indian equity market history, says something uncomfortably simple: the investors who lost money on SIPs are almost entirely the ones who stopped.
The ET Wealth–Crisil SIP Study 2026 – which runs the numbers across all 120 diversified, actively managed equity funds with a continuous NAV history since January 2011 – arrives at a finding that should permanently reframe how Indians think about systematic investing.
A 10-year SIP investor has zero probability of negative returns. Not low probability. Zero.
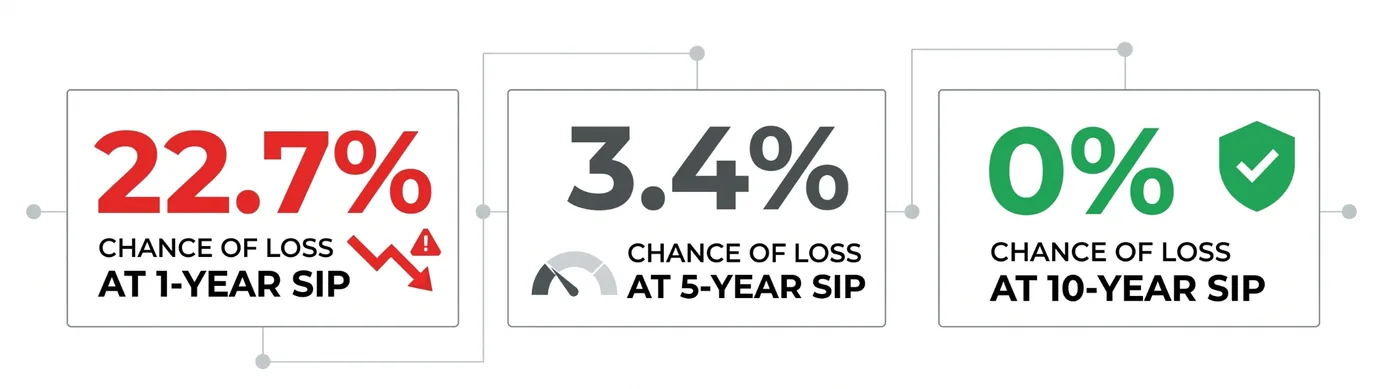
The decay curve of risk is steep. At 1 year, nearly one in four SIP investors is sitting on a loss. By year 4, that chance collapses to below 2%. By year 6, it's approaching zero. At 10 years, across all 120 schemes, not a single investor – regardless of when they started – ended in the red.
Time doesn't just reduce risk. It eventually eliminates it.
The crash that proved the point
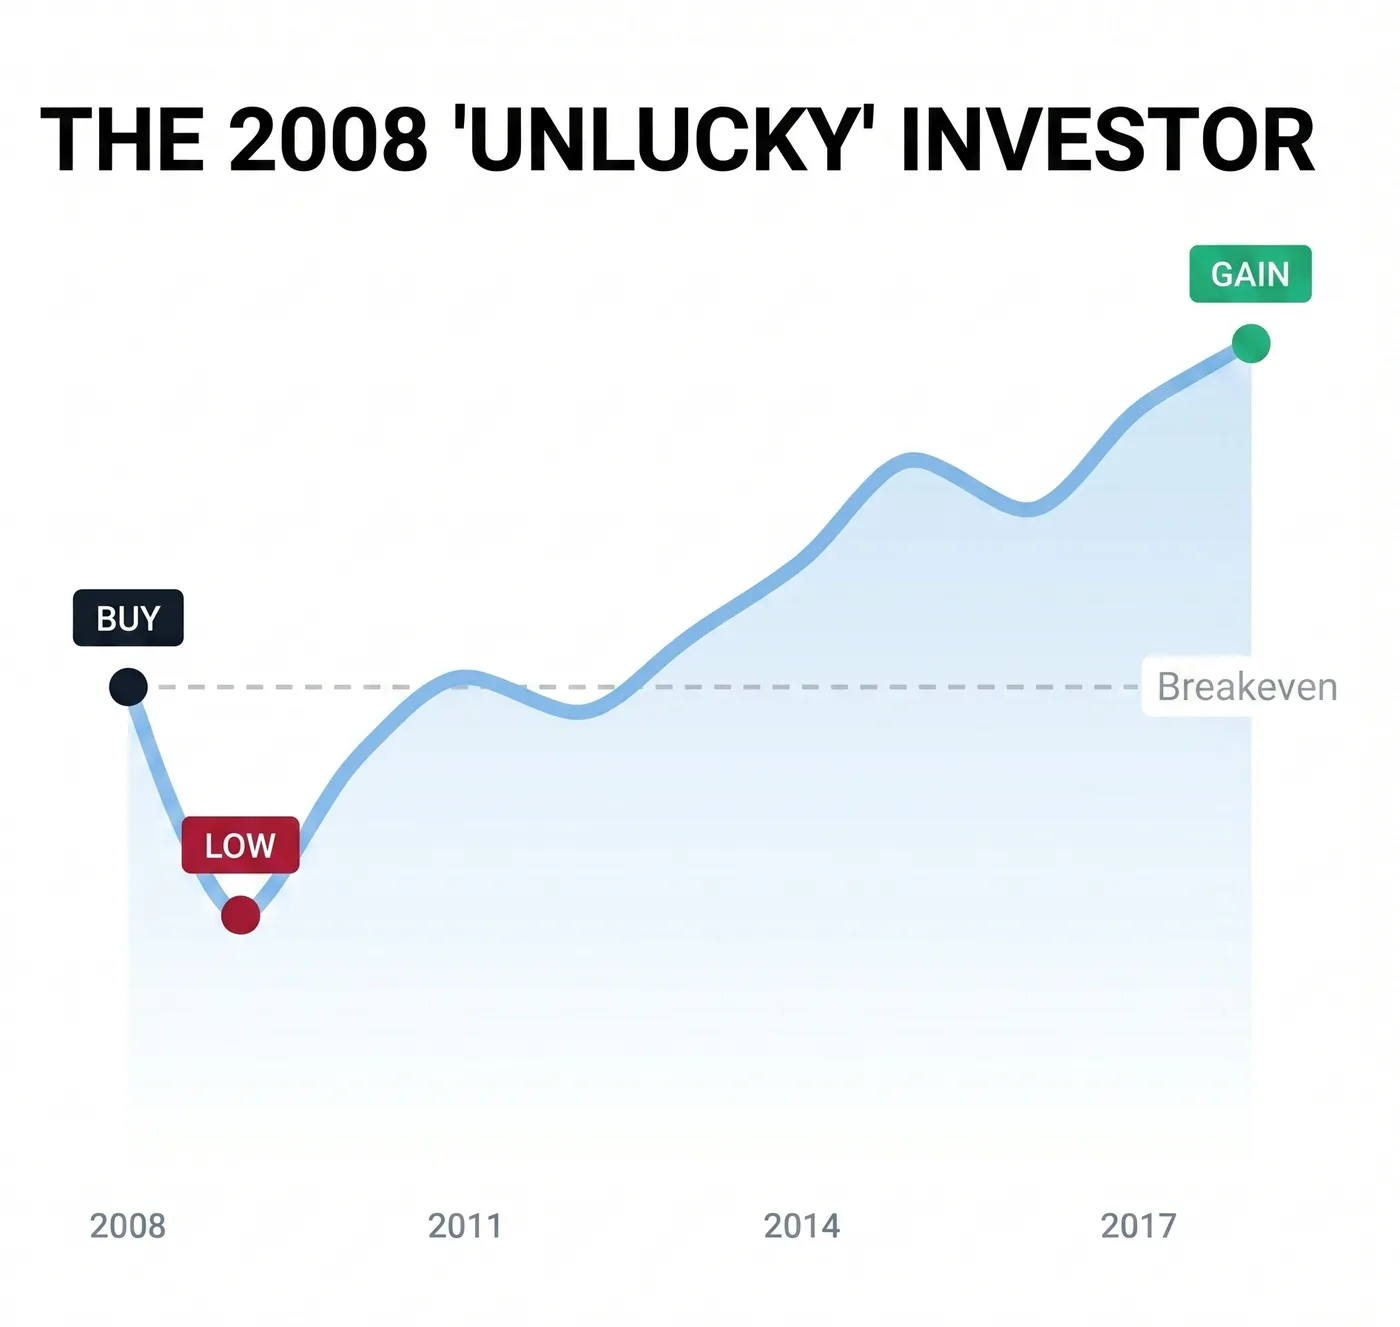
The most instructive case study in the study isn't a success story – it's a disaster. Consider the investor who started a SIP or lump-sum at the Nifty's all-time high in early 2008, right before the global financial crisis erased 60% of portfolio value. The worst possible timing, by definition. Right?
That unlucky investor – who bought at the 2008 all-time high and watched their portfolio halve – was back to breakeven in 34 months. Their 10-year CAGR: +5.3%.
The NSE's own 29-year data on all-time-high investing reinforces this from a different angle. Of 749 all-time highs identified between 1996 and 2025, investors who entered at any of those peaks and held for 10 years earned a median CAGR of 11.6%.
The market's long-term drift upward is powerful enough to overcome even the cruelest entry point – provided you give it enough runway.
The Covid crash of March 2020 tells a similar story for SIP investors. The Crisil data shows that 1-year SIPs took the full −50.3% hit at the trough. But 5-year SIP investors at the same crash point saw their returns fall only to −8.8%. Investors in 7-year and 8-year SIPs remained in positive territory throughout – their portfolios barely registered the panic that paralysed markets.
| SIP started | Avg return before crash | Return at crash trough | Return by March 2026 |
|---|---|---|---|
| 1-year (Mar 2019) | +16.3% | −50.3% | +12.7% |
| 3-year (Mar 2017) | +6.8% | −13.1% | +12.5% |
| 5-year (Mar 2015) | +8.9% | −4.9% | +13.5% |
| 7-year (Mar 2013) | +12.2% | +1.9% | +13.5% |
| 9-year (Mar 2011) | +13.2% | +3.5% | +13.2% |
Source: ET Wealth–Crisil Intelligence SIP Study 2026
The returns vs reliability trade-off
Here's the honest trade-off. A 1-year SIP investor has a 37.8% shot at earning 20%+ returns. A 10-year investor's odds of that same outcome drop to 8.9%. So yes – staying longer means giving up the chance of a big win.
Short-tenure investors are essentially running a concentrated bet on market timing. They can win big, but the distribution of outcomes is wide and varied. Long-tenure investors are buying something different: the near-certainty of a decent outcome.
What you get by staying longer is a floor that doesn't crack. Across 120 schemes over 15 years, no 10-year SIP investor earned below 7% CAGR. Not one.
So why do people stop?
Because everything around them is designed for short time horizons. Distributors earn when SIPs start, not when they run. Fund rankings are measured over 1–3 years. Financial news reports quarterly NAV moves. The whole system is optimised for the short game – while your actual wealth creation needs the long one.
Then there's the pain itself. A psychological asymmetry at play: loss aversion. A 20% crash feels twice as bad as a 20% gain feels good – that's just how our brains are wired. When statements go red, the rational thought ("I'm buying units cheap right now") loses to the gut feeling ("I need to make this stop"). Pausing a SIP during a crash is the financial equivalent of selling your kirana store because wholesale prices went up.
The only number that matters
Seven to ten years. That's it. Five is Crisil's floor. Seven is where genuine stability sets in. Ten is where the data runs out of bad outcomes entirely. The maths isn't complicated – compounding is straightforward.
What's hard is the behaviour: sitting still through 2008, through Covid, through 2022, through whatever comes next. The investors who did that didn't just recover. They ended up exactly where the numbers said they would.
The market isn't the risk. You are. More precisely: the decision to stop is the only mechanism by which a long-term SIP investor actually loses. Keep the SIP running, and the data has your back. Every single time.
Tools to try
Run the numbers yourself.
Free calculators that go with this issue. Built for Indian rules (rupees, inflation, tax regime).
- SIP Calculator – Monthly Mutual Fund Returns India
Estimate the future value of a monthly mutual-fund SIP in India. Plug in your SIP amount, expected return (8–12% historical equity), and horizon to see the corpus and gain split.
- Step-up SIP Calculator – Annual Increase Returns
Project the future value of a SIP that grows every year with your income. A 10% annual step-up can roughly double the final corpus over 20 years vs a flat SIP. Calibrated for Indian equity returns.
- Crorepati Calculator – ₹1 Crore SIP Target India
How much monthly SIP do you need to reach ₹1 crore (or any target corpus) in your time horizon? Backsolves the SIP for Indian equity, debt, and hybrid mutual funds at your expected rate of return.
- FIRE Calculator India – Retire Early Corpus & Age
Financial Independence, Retire Early – for Indian families. Compute the corpus you need, the monthly SIP to get there, and your FIRE age. Adjusted for 6–7% Indian inflation, not US 3%.
← Newer issue
International Mutual Funds Are Outperforming. But How Accessible Are They?
Older issue →
Betting on IPL: The Game Behind the Game
Also worth reading

29 May 2026
Betting on IPL: The Game Behind the Game
IPL viewership dropped 26% the year India banned real-money fantasy gaming. The 250 million users didn't go home – they went underground, to WhatsApp groups and prediction markets. Here's what India broke when it banned Dream11.

21 May 2026
The mutual fund return number: choose your reality wisely
Three metrics – CAGR, XIRR, Rolling Returns – tell three completely different stories about the same investment. Here's which one you should actually be using.