The hybrid fund that barely changed its mix, and beat almost all its peers
What balanced advantage funds did when the market fell
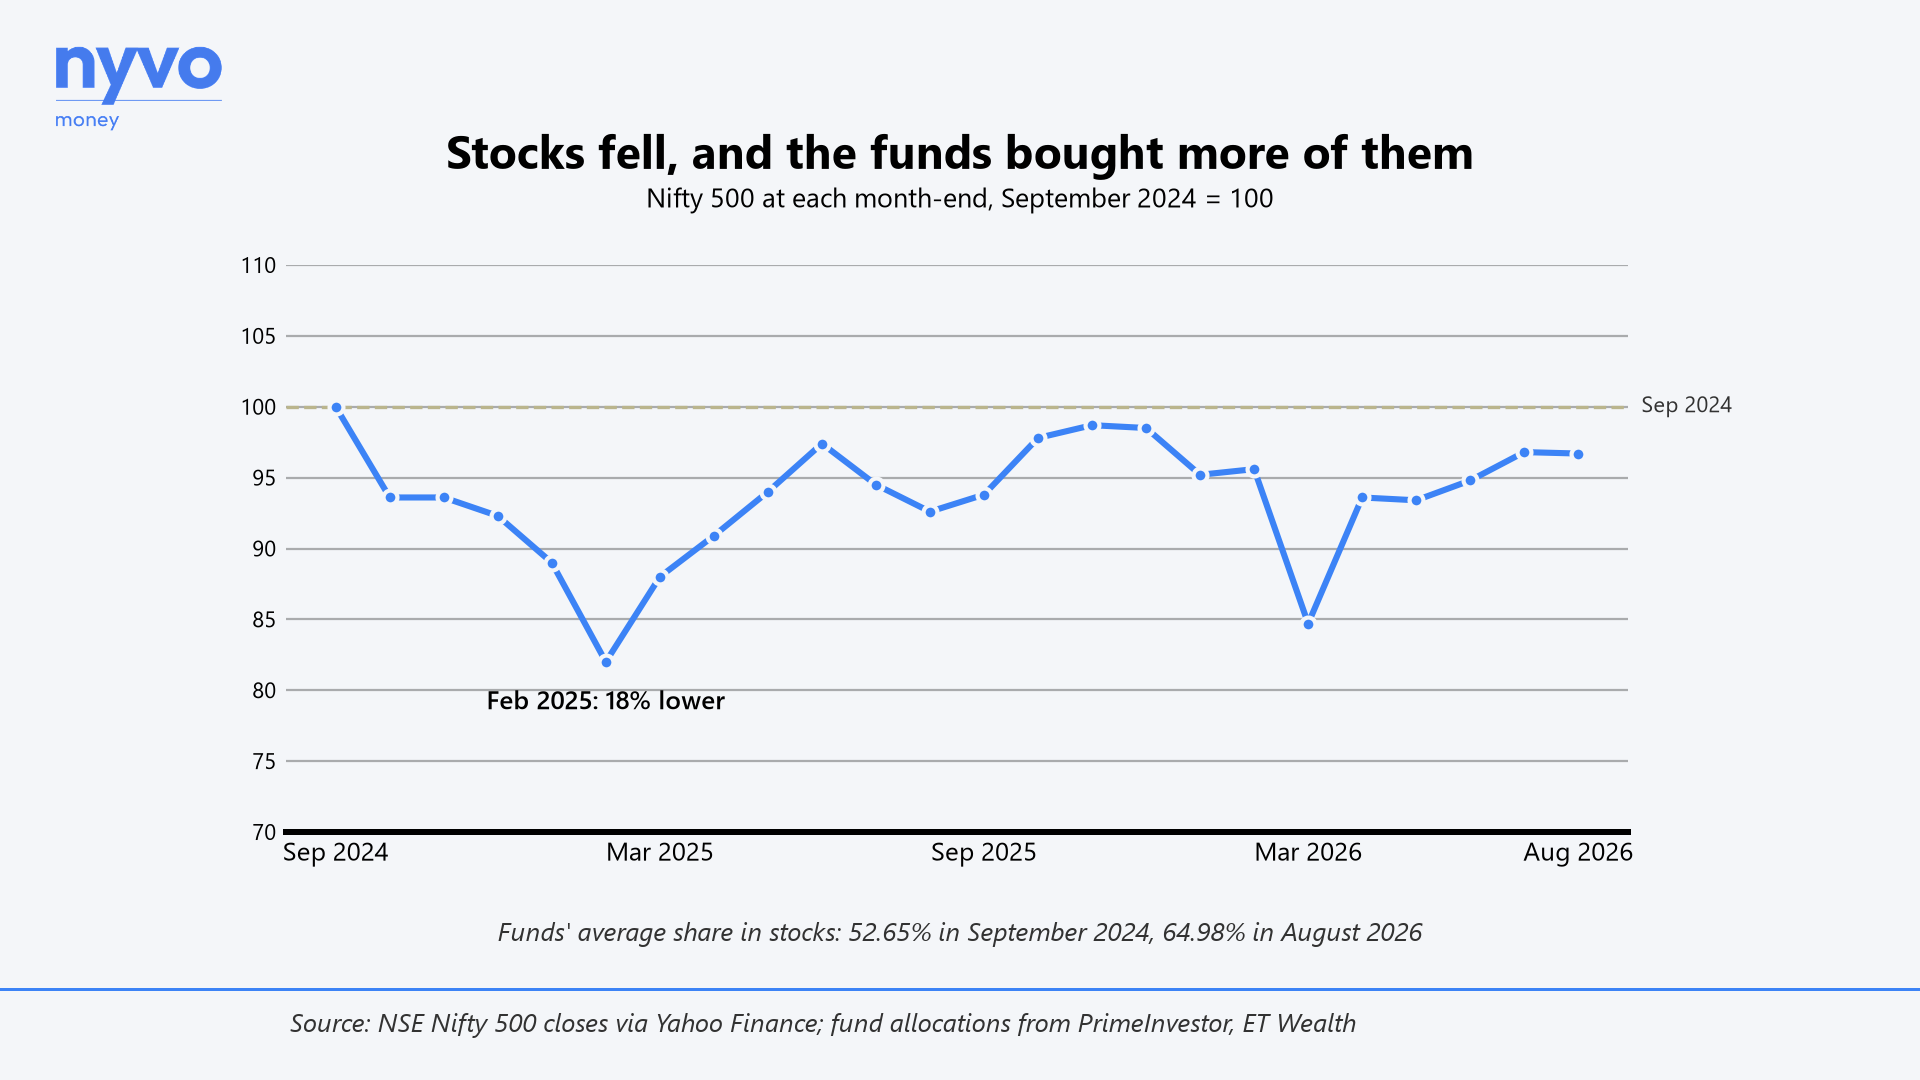
Between September 2024 and August 2026, 30 of 34 balanced advantage funds raised the share of their money held in stocks. On average, it went from 52.65% to 64.98%.
That's their job. A balanced advantage fund, a kind of hybrid fund, moves money between stocks and bonds on its own. It buys stocks when they look cheap and trims them when they look expensive. Over the same two years, the Nifty 500 index fell 19% from its September 2024 peak to February 2025, then fell again this March.
Why the busiest funds should have done best
If the job is moving money at the right moments, the funds that moved the most should have handled the fall best.
They did the worst.
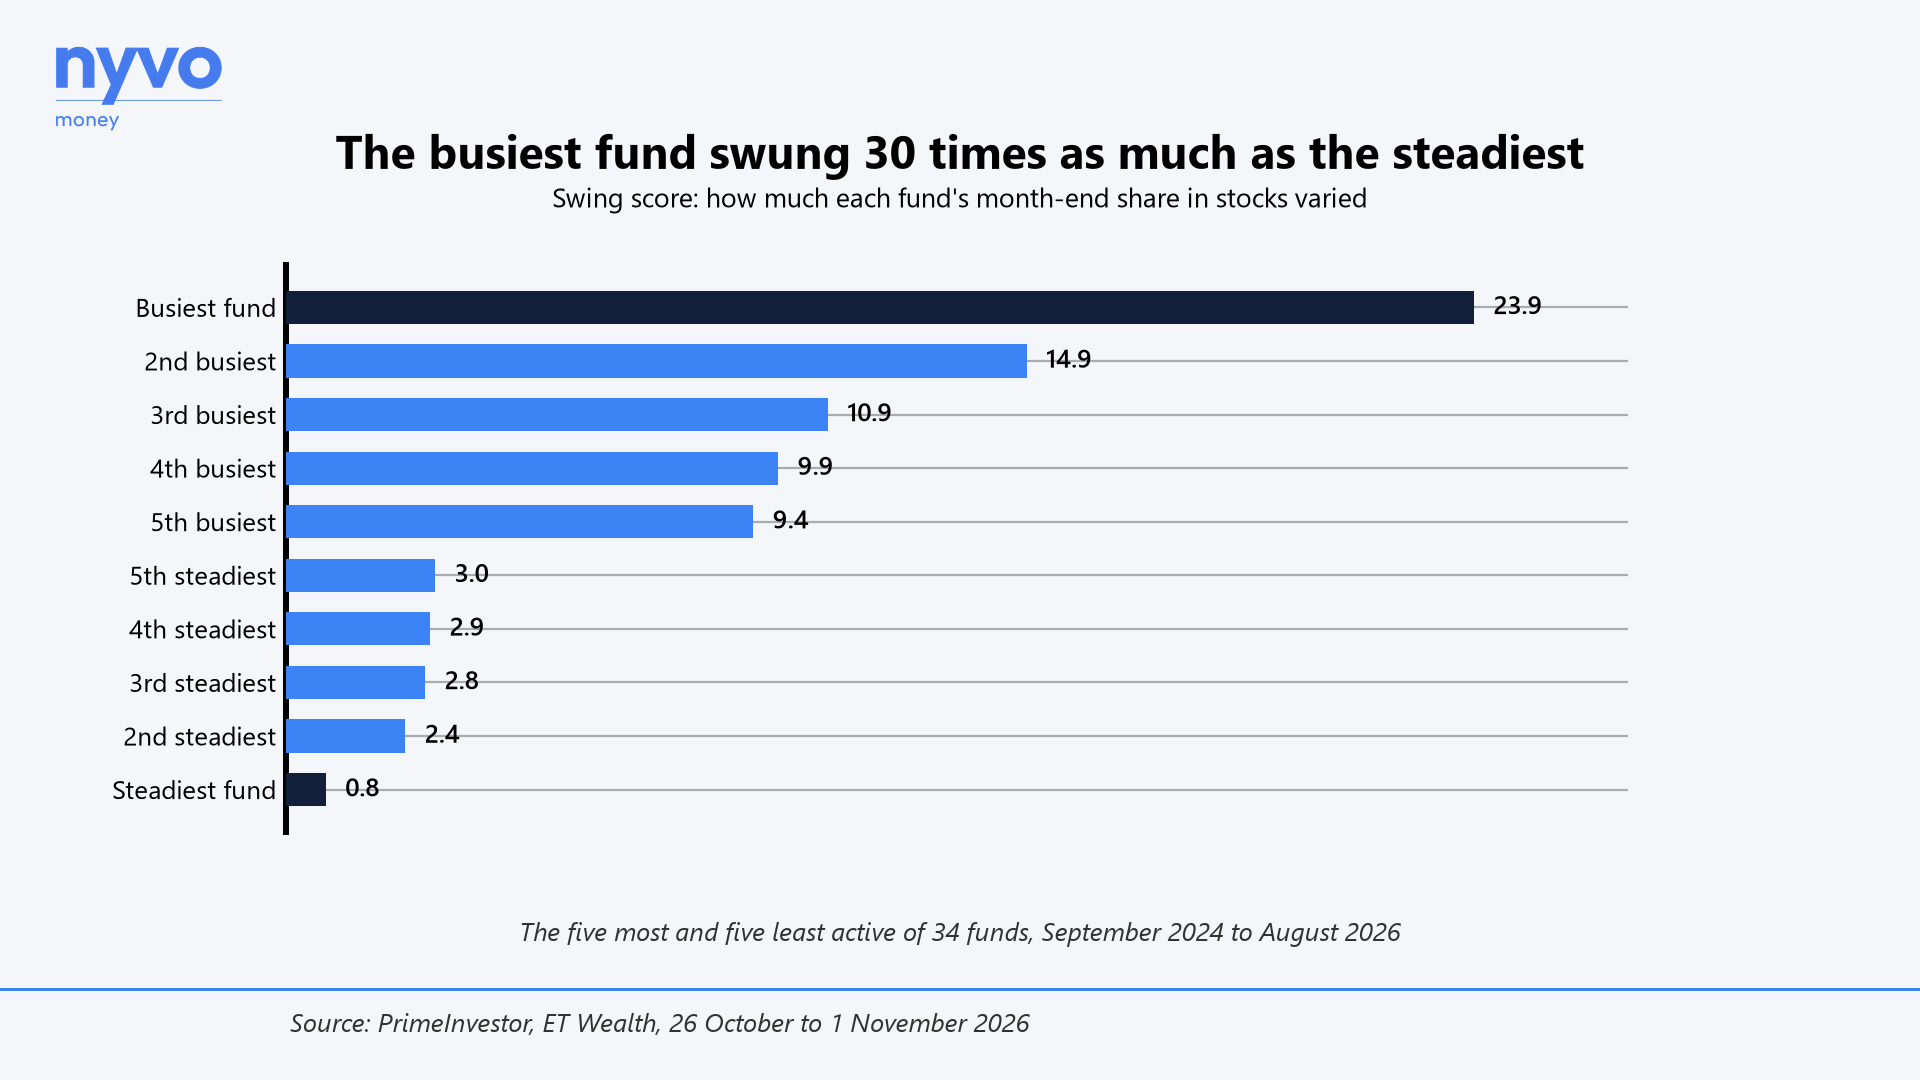
PrimeInvestor, a fund research firm, scored how much each fund's stock allocation swung from month to month over those two years. The busiest fund scored 23.9, and lost 5.05% a year. The steadiest scored 0.8. Its allocation barely changed, and it made 3.57% a year, the third-best return in the group.
What the funds are actually moving
The number that matters is net equity, the part of a fund that rises and falls with the stock market.
To be taxed like an equity fund, most balanced advantage funds keep at least 65% of their money in Indian shares. They then cancel out part of that with derivatives, so it no longer moves with the market. What's left is net equity. It's the number the funds were raising, and the one that decides what an investor gets back.
How a fund decides how much to keep in stocks
Each fund follows its own model, and the models watch different things.
Some go by valuation: price-to-earnings, price-to-book and dividend yield. These move slowly. When prices fall, stocks look cheaper, so the fund buys more and holds on.
Others follow the market's direction. They cut stocks as prices fall and add them back as prices rise. One trend-following fund held 43% in stocks in March, 67% in July and 49% in September.
Why changing direction costs money
Moving a lot isn't the problem by itself. The best performer in the group follows a valuation model. It raised its stock allocation from about 37% to 67% as prices fell, and made 4.07% a year.
The cost comes from reversing. A fund that sells after a fall and buys back after a rebound gives up the difference each time. In a market that keeps lurching both ways, as this one has, those reversals add up.
How the busiest and steadiest funds compare
The second-busiest fund did worst of all, losing 7.21% a year over two years.
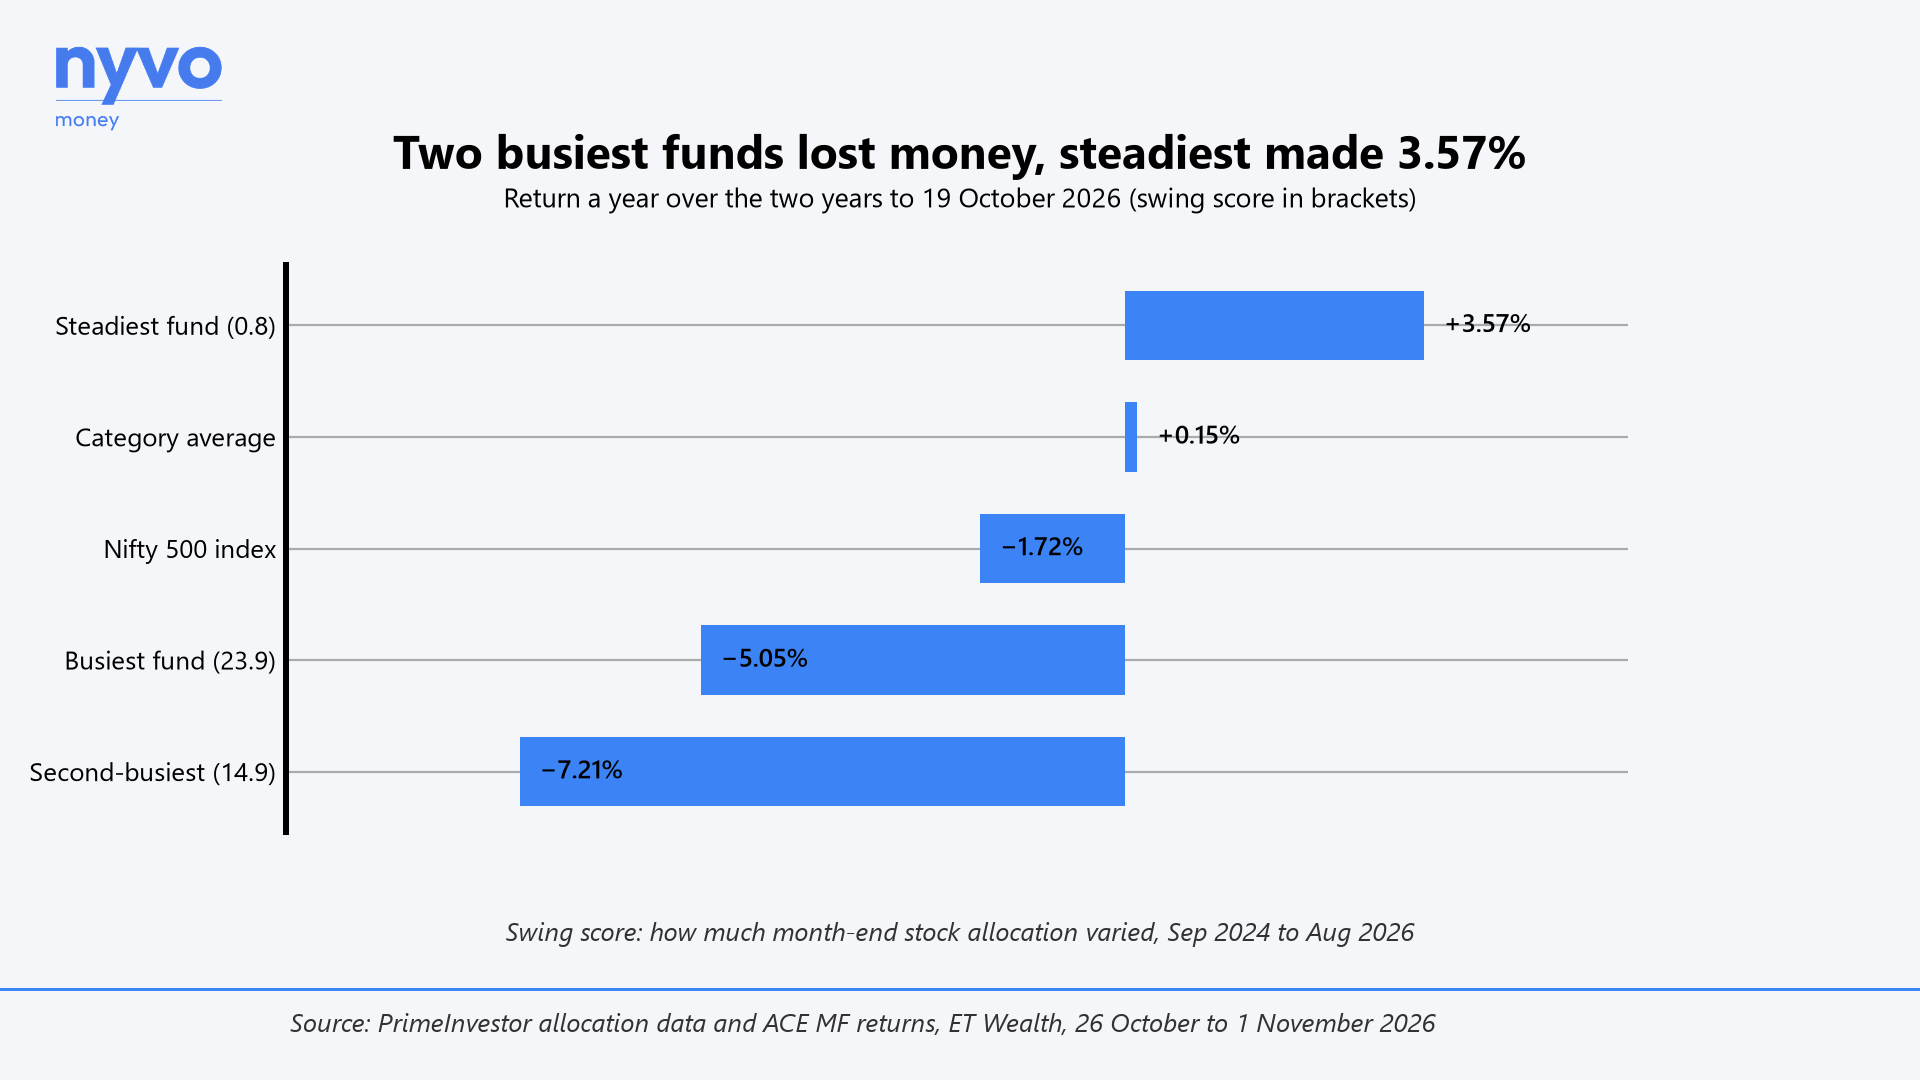
Over the past year alone, the category lost 3.16%, about half the Nifty 500's 6.21% fall. That cushion is what these funds are sold on. The two busiest lost 6.08% and 6.16%, almost as much as the market.
It isn't a strict rule. One fund with a swing score of 9.9 still made 4.03% a year. But the two busiest funds were the two worst performers.
When investors put money into these funds
Much of the money arrived before the fall, when stocks were expensive.
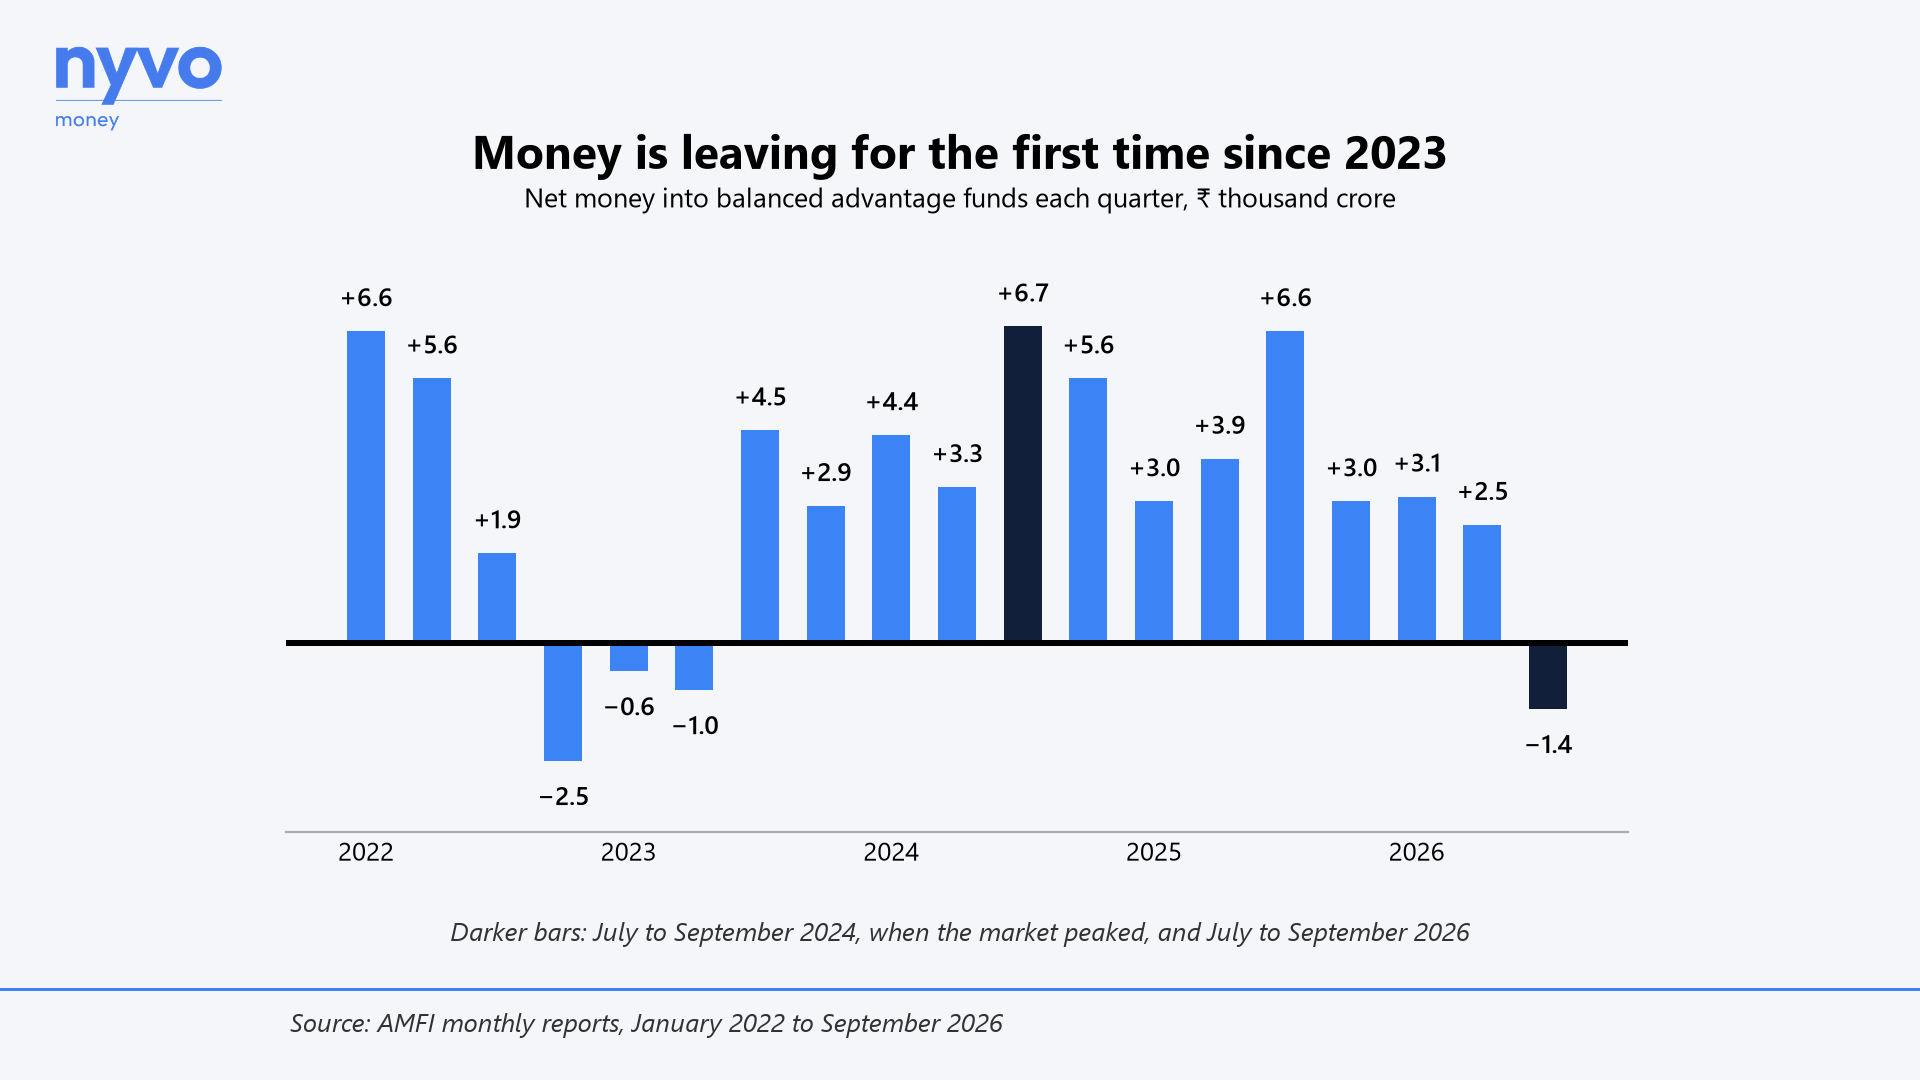
Money in these funds has almost doubled since January 2022, to ₹3.16 lakh crore across 57.7 lakh accounts. In the 12 months to September 2024, investors put in a net ₹17,757 crore. The biggest month was August 2024, at ₹3,215 crore. The Nifty 500 peaked the next month.
The average account holds about ₹5.5 lakh, against about ₹2 lakh in equity funds. That points to lump sums, and a lot of it came in near the top.
Where investors' money is going now
Now investors are taking money out, after the funds bought the dip for them.
From July to September, they took ₹1,393 crore more out of balanced advantage funds than they put in. The last stretch like this ran from October 2022 to June 2023, during and after RBI's previous round of rate hikes. ₹4,108 crore left then.
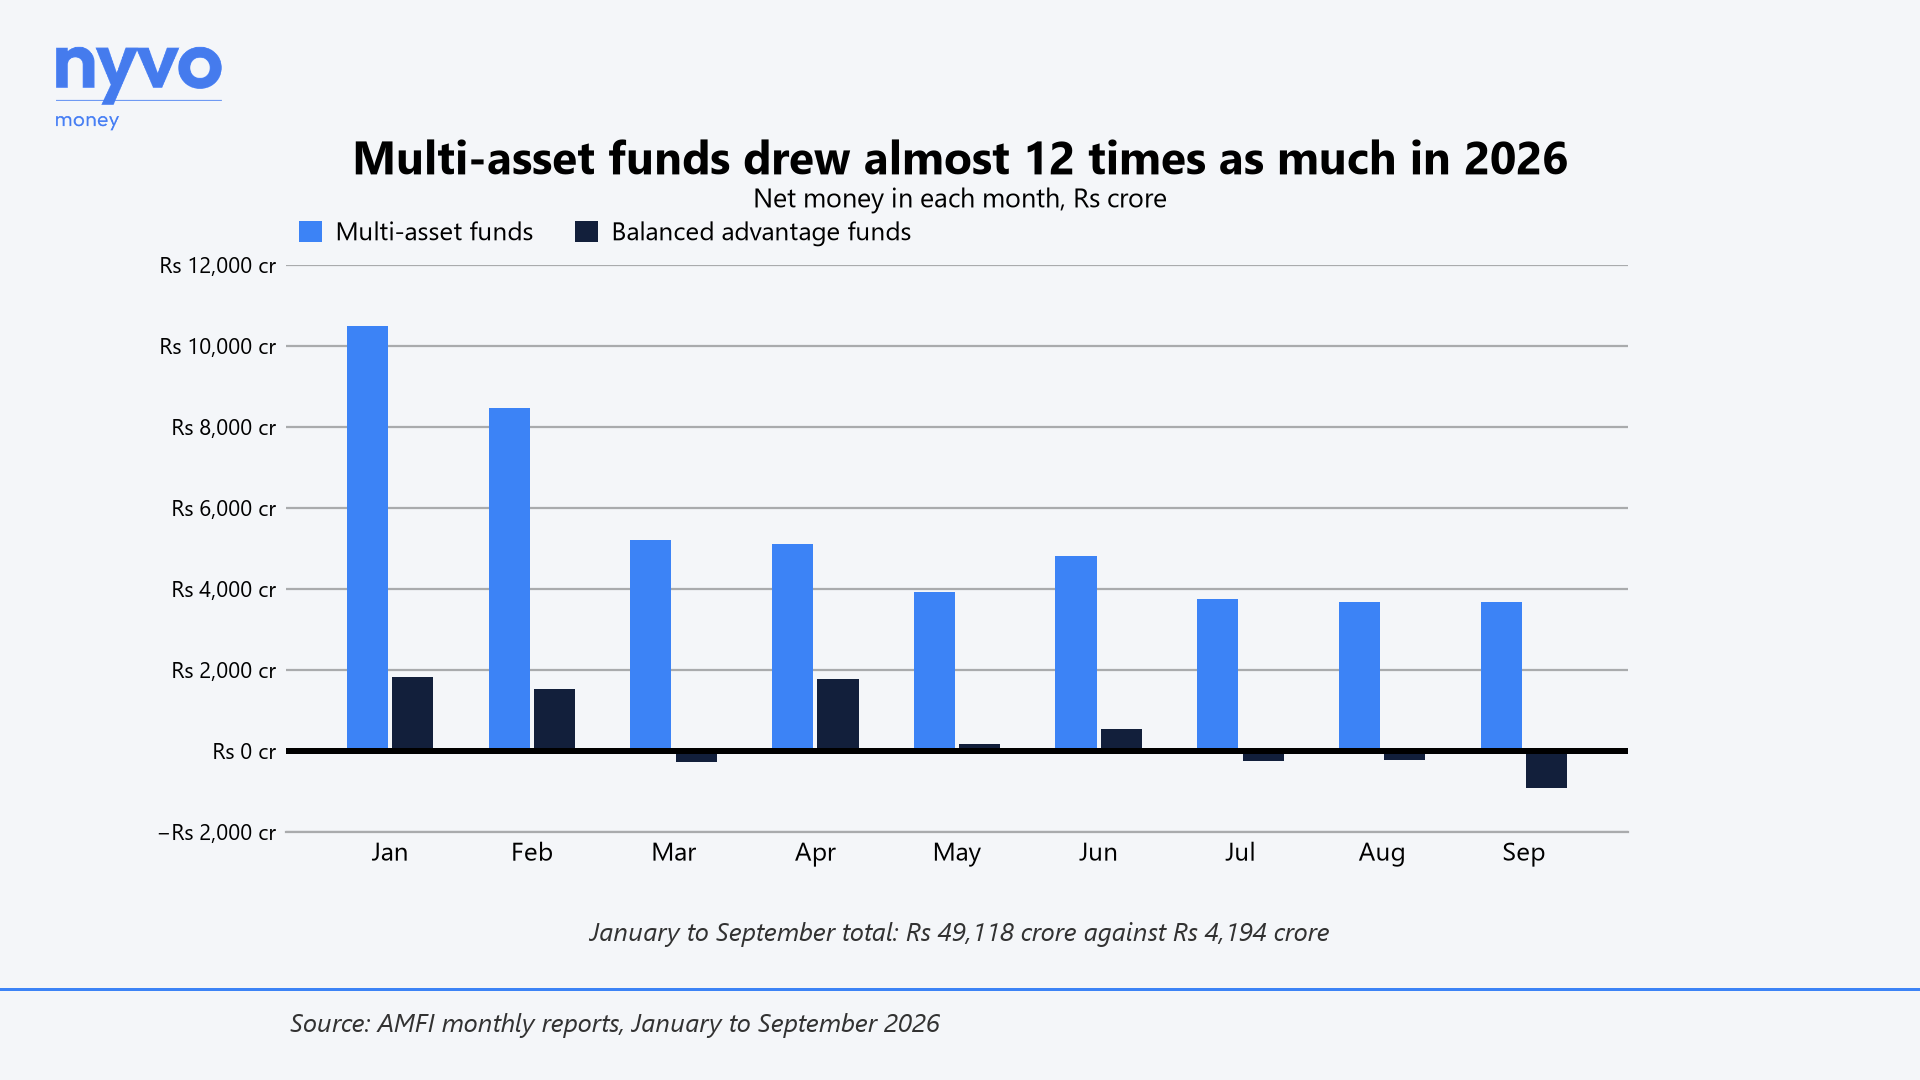
Meanwhile, money is pouring into multi-asset funds, which spread it across stocks, bonds and usually gold. From January to September they drew ₹49,118 crore, almost 12 times what balanced advantage funds got. In the year to mid-October, gold rose about 10% while the Nifty 500 fell 6%.
What this means for your money
A balanced advantage fund isn't half in stocks any more. The average is now about two-thirds, and some funds hold more than 80%.
The funds bought the dip on their investors' behalf. A family that sells now steps out before that buying has had a chance to pay off.
The fund that did best over these two years is the one that barely changed its mind. The test now is whether its investors can do the same.
Educational content, not investment advice. Past performance does not guarantee future results; what suits your household depends on your own goals, horizon and savings.
Now in the nyvo app
Plan it for real in the nyvo app.
Goals, projections, fund grades and your whole family's money – in one place. Free. SEBI-registered.
Tools to try
Run the numbers yourself.
Free calculators that go with this issue. Built for Indian rules (rupees, inflation, tax regime).
- Lumpsum Calculator – One-Time Investment India
Estimate the future value of a one-time mutual-fund or fixed-income lumpsum in India. Enter principal, expected return and horizon to see the corpus.
- Mutual Fund Returns Calculator – SIP + Lumpsum India
Project combined returns from a mutual-fund SIP, lumpsum and top-ups in one place. Built for Indian equity, debt, hybrid and ELSS funds.
Also worth reading

8 October 2026
How game theory can help beat a falling market
The Nifty 50 is down 13.7% in 2026. Von Neumann's game theory explains why that is a discount for some investors and a trap for others.
21 August 2026
The Fund Category That Promised Everything and Explained Nothing
₹21,000 crore rushed into income plus arbitrage funds on a promise of equity-style tax and debt-style calm – then roughly ₹2,000 crore left. Nothing about the mandate changed; the promise met the portfolio.

21 May 2026
The mutual fund return number: choose your reality wisely
Three metrics – CAGR, XIRR, Rolling Returns – tell three completely different stories about the same investment. Here's which one you should actually be using.